Antidiabetic, and radical scavenging activity of Kigelia africana fruit fractions
Tumelo Akapelwa Muyenga
Department of Physiological Sciences, School of Medicine and Health Sciences, Mulungushi University, Livingstone, Zambia
Department of Pharmacology and Therapeutics, Faculty of Health and Veterinary Sciences, University of Namibia, Namibia.
Bamitale K. Dominion Samuel
Department of Internal Medicine and Pharmacology, Faculty of Health Sciences, Walter Sisulu University Mthatha, Eastern Cape
Kibuule Dan
Department of Pharmacology and Therapeutics, Faculty of Health Sciences, Busitema University, Uganda.
Christabel N. Hikaambo
Department of Pharmacy, School of Health Sciences, University of Zambia, Lusaka, Zambia.
Mutenta Nsokolo Nyambe
Department of Pharmaceutical Chemistry and Pharmacognosy, Faculty of Pharmacy, Nutrition and Dietetics, Lusaka Apex Medical University, Lusaka, Zambia.
Ezeala Christian
College of Health Agriculture and Natural Sciences, Africa University, Mutare, Zimbabwe
DOI: https://doi.org/10.55320/mjz.50.1.376
Keywords:Kigelia africana, antidiabetic, antioxidant, phytochemicals, radical scavenging, gas chromatography-mass spectrophotometry (GC-MS), traditional medicine, total phenolic content, total flavonoid content, Wistar rats
ABSTRACT
Background: Traditional medicine is gaining traction in Africa. 92.1% of diabetes patients at the University Teaching Hospital in Zambia use herbal medicine. Kigelia africana is a botanical species used in traditional medicine for diabetes due to its phytochemical composition. This study aimed to determine the phytoconstituents, radical scavenging activities, total flavonoid concentration, and total phenolic content of the antidiabetic bioactive Kigelia africana fruit fractions.
Methods: Using UV spectrophotometer we determined the total phenolic content (TPC), total flavonoid content (TFC) and free radical scavenging activity. Alloxan-induced diabetes rat models were used to determine the antidiabetic effect in vivo. Phytoconstituent analysis was via gas-chromatography Mass spectrophotometry (GC-MS).
Results: The ethyl acetate fraction demonstrated superior antidiabetic activity, reducing blood glucose levels from 28.42±2.7 mmol/l to 8.16±4.4 mmol/l. Statistical analysis showed no significant difference between the ethyl acetate fraction and Glibenclamide,(p=0.152). Although the ethyl acetate fraction had a higher reading, there was no statistically significant difference found in Total Phenolic content (TPC) (p=0.3) and Total Flavonoid content (TFC) (p=0.06). IC50 values for DPPH were 0.05330 (chloroform), 0.05352 (ethyl acetate), and 0.4013 (butanol). GC-MS analysis revealed the presence of important fatty acids, methyl furfural, furan carboxylic acid and 4-pyran-4-one derivatives.
Conclusion: The GC-MS fingerprint of the antidiabetic fractions revealed important fatty acids and phenolic compounds that could be attributed to the observed antidiabetic activity.
INTRODUCTION
The utilization of herbal products as a supplementary and alternative medicine for the treatment of diabetes is seeing a notable global upsurge.[1-2] Medicinal plants have a significant role as a valuable reservoir of distinct molecular structures, which present safer therapeutic options for the control and treatment of diabetes. The majority of herbal remedies utilized for the treatment of diabetes have undergone limited scientific assessment in terms of their effectiveness and safety profiles, as well as potential interactions with conventional medications.[3]
Kigelia africana is a prominent medicinal plant in Africa that has been traditionally utilized for the treatment of diabetes. In Zambia, traditional healers employ the fruits of certain plants for the management of symptoms associated with diabetes.[4] This practice is mostly attributed to the wide range of phytoconstituents present in these fruits, which exhibit variations based on their geographic origins.[5-6] The antioxidant benefits of Kigelia africana have been ascribed to the presence of flavonoids and other phenolic compounds, which exhibit free radical scavenging action.[7] The potential antioxidant properties of Kigelia africana may contribute to its anti-diabetic benefits by mitigating oxidative stress-induced damage to pancreatic beta cells and enhancing insulin production[8-10] . Furthermore, the study conducted by Sarian et al. provided evidence indicating that flavonoids exhibit a correlation with a decrease in the activity of alpha-glucosidase.[9] This reduction in enzymatic activity subsequently leads to a decrease in postprandial glucose levels among individuals with diabetes. In a similar vein, AL-Ishaq et al. have documented that several flavonoids exhibit a mitigating impact on diabetes mellitus by means of diverse modes of action.[11]
In this study, we investigated the antidiabetic and free radical scavenging properties of fractions derived from the fruit of Kigelia africana. Additionally, we measured the total phenolic and total flavonoid content of these fractions.
MATERIALS AND METHODS
Chemicals and Reagents
The materials utilized in this study consisted of various analytical standard substances, namely methanol, quercetin, 5% sodium nitrate, 1M sodium chloride, 10% aluminium chloride, 7% sodium carbonate, Folin-Ciocalteau reagent, reagent grade gallic acid, ascorbic acid, and DPPH. Additionally, Accu-Check glucometer and sticks were employed for glucose measurement. The solvents employed included ethyl acetate, chloroform, and butanol. For accurate volume measurements, micropipettes (10-100L) and pipettes (1-10ml) were utilized. The UV spectrophotometer was used for absorbance measurements. Furthermore, rat-handling tunnels were employed for the safe handling of laboratory animals. The experimental apparatus included a Soxhlet apparatus, rotary evaporator, Büchner's funnel, measuring cylinder, beakers, and an electronic balance.
Plant Material collection and authentication
The K. africana fruit was collected during the month of January in the year 2022, specifically in the Kazungula District, which is in the Southern Province of Zambia. The plant material underwent authentication in the Department of Biological Sciences within the School of Natural Sciences at the University of Zambia (UNZA).
Plant extraction and fractionation
The fruits of K. africana were subjected to cutting, mincing, and subsequent air drying within a designated shed for a duration of one week. The desiccated pulverized fruits were subsequently pulverized and filtered using a screen with a hole diameter of 0.6 mm to acquire a uniform powder, which was afterwards stored at a temperature of 10°C. A quantity of 500 grammes of powdered Kigelia africana fruit was utilized in a Soxhlet extraction process, employing 2500 milliliters of water as the extracting solvent, resulting in the production of an aqueous extract. The extracted sample was subjected to a drying process under decreased pressure utilizing a Rotavapor at a temperature of 60°C. Subsequently, a liquid-liquid fractionation technique was employed to separate the extract into three distinct fractions, utilizing Chloroform, ethyl acetate, and n-butanol.[12]
Total Phenolic content
The determination of total phenolic content was performed following the methodology outlined by Makkar, H.P.S. et al.[13] Each fraction was produced at a concentration of 10 mg/ml and 1 ml of each fraction was thereafter added to the test tubes. A volume of 5 ml of Folin-Ciocalteu Reagent (FCR) with a concentration of 10% was introduced, along with 4 ml of sodium carbonate (Na2CO3) solution at a concentration of 7%. The resultant combination, exhibiting a blue hue, was subjected to incubation for a duration of 30 minutes at a temperature of 40°C within a water bath. Following incubation, the absorbance at a wavelength of 550 nm was measured using a UV spectrophotometer. The specimens were made in triplicate, and the outcomes were determined by employing the standard gallic acid curve. The quantification of phenolic content in each distribution extract was conducted by employing the standard gallic acid curve. The results were then reported as gallic acid equivalent (GAE) per gramme of dried plant extracts, denoted as GAE mg/g. The calculation of the total phenol content of the distributed extracts was performed using the subsequent equation 1:GAE × V/m (1)
The content of gallic acid (GAE) was estimated from the calibration curve, expressed in milligrams per milliliter (mg/ml). The final volume of the fraction (V) and the weight of the plant extract (m) were measured in milliliters (ml) and grammes (g), respectively.[14]
Total flavonoid content
The determination of the total flavonoid content of the fractions was carried out following the methodology outlined by Swarnalatha et al.[15] Three test tubes were prepared, each containing 1 ml of fraction solution with a concentration of 2000 µg/ml. Subsequently, 0.5 ml of a 5% NaNO3 solution was added to each test tube. Subsequently, the combination was let to remain undisturbed for a duration of five minutes. Subsequently, a volume of 0.5 ml of a 10% solution of AlCl3 was introduced, followed by a six-minute incubation period. Afterwards, 2.0 ml of a 1 M solution of NaOH was added to the mixture. Subsequently, distilled water was introduced in order to achieve a final amount of 10 ml. The solution was incubated at ambient temperature for a duration of 20 minutes in order to facilitate the attainment of a complete reaction. The measurement of absorption was conducted at a wavelength of 510 nm. The quantification of flavonoid content in each fraction was conducted by employing the quercetin standard curve. The values were quantified in milligrams per gramme of quercetin equivalent (QE). The calculation of the total flavonoid content of the plant extracts was performed using the subsequent equation 2:X = C V/m (2)
In the equation, X represents the flavonoid content, mg/g denotes the distribution extract in terms of quercetin equivalents (QE), C represents the concentration of the quercetin extract (mg/ml) obtained from the calibration curve, V denotes the final volume of the distribution extract (ml), and m represents the weight of the plant extract (g).
DPPH radical scavenging activity
The distribution extracts were produced at concentrations of 0.1, 0.3, and 0.6 mg/ml. Subsequently, 1 ml of each concentration was aliquoted into separate test tubes. Each test tube was supplemented with 3 ml of DPPH, while a solution consisting of 10 ml and composed of 99% methanol was created. The test tubes were placed in a shaded area with a temperature of 25°C for a duration of 30 minutes to allow for the completion of the reaction. Following a duration of 30 minutes, the solutions' absorbance was assessed in triplicate using a spectrophotometer at a wavelength of 517 nm relative to DPPH in methanol, which was employed as a reference for comparison. The determination of antioxidant capacity was conducted by employing the subsequent equation 3:AA% = 1−(Ab sample/Ab control) ×100 (3)
"Ab sample" is the absorbance of the sample and "Ab control" is the absorbance of the negative control.
GC-MS analysis
The Scion 436 GC-MS Single Quadruple instrument was utilised for the purpose of conducting GCMS analysis. This instrument was fitted with a SCION 5MS column, which is known for its low bleed and high inertness properties. The SCION 5MS column is composed of a mixture of 5% phenyl and 95% dimethyl polysiloxane. The capillary column used in the experiment had a length of 30 meters, a diameter of 250 micrometers, and a thickness of 0.25 micrometers. The carrier gas employed in the experiment was pure helium gas (99.99%) with a consistent flow rate of 1 ml/min. In the context of GC-MS spectrum detection, the electron ionization energy technique was employed, with a high ionization energy of 70 eV (electron volts). The scan period was set at 0.2 seconds, and the range of detected fragments spanned from 40 to 600 m/z. A split ratio of 10:1 was employed in conjunction with an injection quantity of 1 micro-L, while maintaining a constant injection temperature of 250 °C. The temperature of the column oven was initially set to 50°C and held for a duration of 3 minutes. Subsequently, the temperature increased at a rate of 10°C per minute until it reached 280°C. Finally, the temperature was further increased to 300°C and maintained for a period of 10 minutes. The identification of phytochemicals in the fractions was conducted by comparing various parameters, including retention time (min), peak area, peak height, and mass spectral pattern, with the spectrum database of legitimate compounds kept in the National Institute of Standards and Technology (NIST) library.
Animals
The study used 30 healthy male Sprague-Dawley rats within the age range of 7 to 12 weeks and with a weight range of 150 to 250 g. The rats were acquired from the Department of Physiological Sciences at the University of Zambia School of Medicine. A minimum acclimatization period of 14 days was provided to the rats in order to adapt to the laboratory setting prior to the commencement of the investigation. The rats were divided into five groups using a random allocation method. The study used six rats per group, with each group receiving a different treatment: Group 1 received normal saline, Group 2 received a 1000 mg/kg dose of the chloroform fraction, Group 3 received a 1000 mg/kg dose of the ethyl acetate fraction, Group 4 received a 1000 mg/kg dose of the n-butanol fraction, and Group 5 received a 0.3 mg/kg dose of Glibenclamide. During the course of the experiment, the rats had unrestricted access to food and drink, with the exception of the day prior to diabetes induction, during which they underwent an overnight fasting period. Nevertheless, the rodents were provided with unrestricted access to water during the duration of the fasting period. The rats exhibited a typical daily rhythm and were housed under ambient room temperature conditions. The observations pertaining to the rats were conducted throughout the morning hours, specifically between 9:00 and 10:00 a.m.IN-VIVO ANTIDIABETIC ACTIVITY
Induction of hyperglycemia
A 10% solution of alloxan monohydrate, which had been freshly produced and diluted in normal saline, was administered to the rats in order to induce hyperglycemia. The rats underwent weighing procedures, followed by the determination of their baseline glucose levels subsequent to an overnight period of fasting. The rats were subsequently allocated into groups of six by a random assignment process. They were then administered alloxan monohydrate through intraperitoneal injection at a dosage of 100 mg/kg body weight. Following this procedure, the rats resumed their regular feeding cycle.[16] Following a period of 72 hours, the blood glucose concentration was assessed, and the animals were categorized as hyperglycemic if their fasting blood glucose level exceeded 7 mmol/l.
Antidiabetic assay
Following the induction of diabetes, the animals were administered fruit fractions at a dosage of 1000 mg/kg body weight. In order to assess the antidiabetic efficacy, fasting blood glucose levels were measured by means of blood collection by a tail vein puncture. The collection of samples occurred at a frequency of every other day for a period of 28 days.
Ethical review approval
The study received approval from the Research Ethics Committee of Mulungushi University School of Medicine (SMHS-MU3-2020-12), the National Health Research Authority of Zambia, and the Research Ethics Committee of the University of Namibia (HG-/162/2021). The animals were accommodated and managed in accordance with the protocols established by the Animal Ethics Research Committee.RESULTS
Extractive value
According to the data presented in Table 1, the chloroform fraction exhibited the highest extraction yield (2.6%), whilst the ethyl acetate fraction had the lowest extraction yield (1.5%).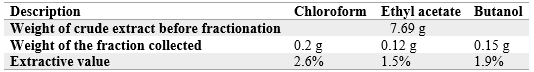
Total Phenolic content (TPC)
The ethyl acetate fraction exhibited the highest measured total phenolic content, with a value of 2.95 mg/g gallic acid. The chloroform extract had the lowest recorded total phenolic concentration, measuring at 2.45 mg/g gallic acid. The results obtained from the fractions did not exhibit any statistically significant variation, as indicated by the p-value of 0.329 (refer to Table 2).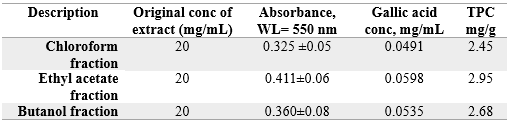
Total flavonoid content (TFC)
The quantification of flavonoid content in the fractions was performed by determining the concentration of quercetin equivalents. The ethyl acetate fraction exhibited the highest flavonoid content, with a concentration of 3.1 mg/g quercetin. The butanol fraction exhibited the lowest recorded value of quercetin at 0.75 mg/g. There was no statistically significant difference seen among the fractions, as indicated by a p-value of 0.06 (Table 3).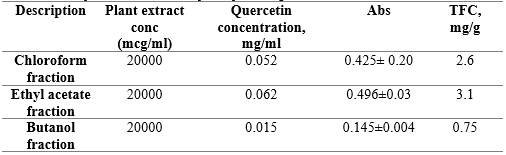
DPPH radical scavenging activity
The radical scavenging activity of DPPH exhibited a dose-dependent increase pattern, with respect to the standard drug. The IC50 value for ascorbic acid was determined to be 0.197 mg/ml. In a similar vein, it was noted that there was a rise in the fractions in a dose-dependent manner, with the n-butanol fraction demonstrating the most effective radical scavenging. The DPPH IC50 values were determined to be 0.05330 for chloroform, 0.05352 for ethyl acetate, and 0.4013 for butanol, as illustrated in Figure 1.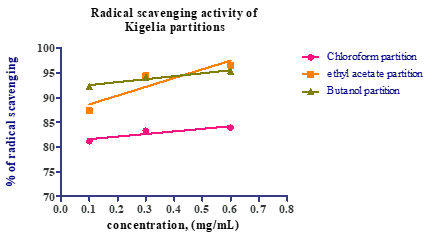
In-vivo Antidiabetic activity
Based on the findings obtained from the experiment, it was discovered that the induction of diabetes using Alloxan monohydrate resulted in a notable alteration in blood glucose levels. The pre-induction blood glucose levels were found to be below 7 mmol/l, however following the induction process, blood glucose levels in certain rats exhibited an increase up to 31.52 mmol/l. Following the administration of treatment, it was seen that the ethyl acetate fraction exhibited the most significant drop in blood glucose levels when compared to the chloroform and butanol fractions. Specifically, the post-induction glucose reading for the ethyl acetate fraction was recorded as 28.42±2.7 mmol/l, which subsequently decreased to 8.16±4.4 mmol/l by day 29. Despite observing reduced glucose levels on day 29 in the ethyl acetate extract group, there was no statistically significant difference compared to the group treated with Glibenclamide. The glucose levels in the Glibenclamide-treated animals decreased from 18.98±4.41 mmol/l to 9.90±0.9 mmol/l (p= 0.152). On the twenty-eighth day of the treatment period, it was observed that all rats administered with normal saline died as a result of persistent hyperglycemia, as depicted in Figure 2.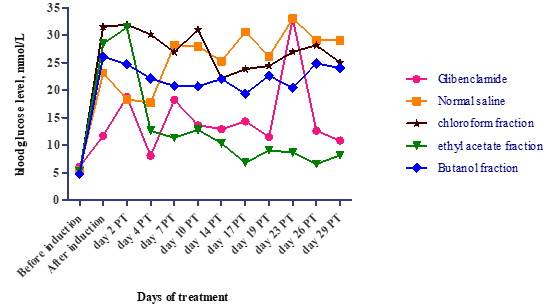
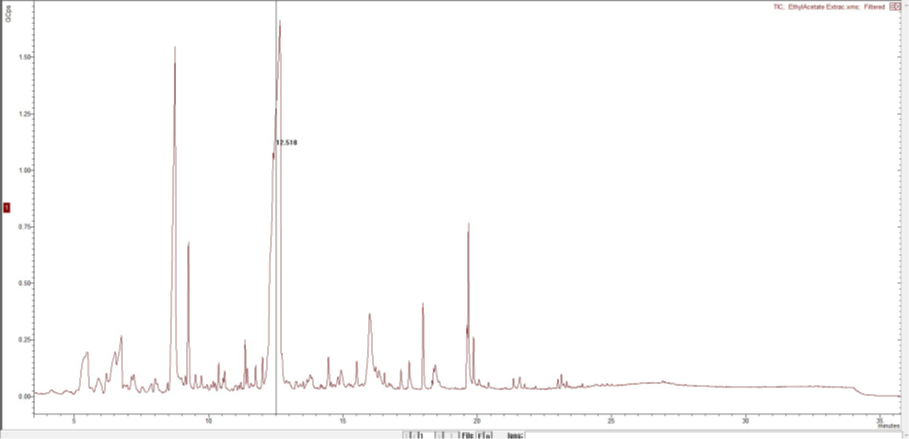
GC-MS Chromatography
The chloroform fraction had the highest number of compounds, totalling 49, followed by ethyl acetate with 46 compounds, and butanol with just 25 compounds. The chloroform fraction exhibited prominent peaks corresponding to specific compounds, including 4H pyran-4-one, 3,4-dihydroxy-2-methyl at a retention time of 8.7 minutes, Hydroxymethylfurfural at 9.2 minutes, Dimethoxycinnamic acid at 17.54 minutes, and Octadecynoic acid, Hexadecanoic acid, and Octadecanoic acid at retention times of 19.65, 19.71, and 19.889 minutes, respectively. In addition, additional substances such as trans-octadecenoic acid and ricinoleic acids, namely 2,4-di-tert-butylphenol, exhibited peak retention times of 21.54, 23.14, and 13.044 minutes, respectively.The peak with the highest retention time in the butanol fraction was detected at 9.37 minutes, and it was shown to be associated with methyl furfural. The compound octadecadienoic acid (Z, Z) exhibited its highest intensity with a retention time of 19.68 minutes. The signal corresponding to 4-pyran-4-one, 5 dihydroxy, 2 (hydroxymethyl) was most prominent in the ethyl acetate fraction, with a retention time of 12.665 minutes. The observed peaks included 4H pyran-4-one, 3,5-dihydroxy-2-methyl at a retention time of 8.754 minutes, 5-hydroxymethyl furfural at 9.254 minutes, pyrimidine 2,4,6-trione at 12.009 minutes, trans Ferulic acid at 17.169 minutes, 3-chloropropinoic acid under-2-enyl ester at 18.591 minutes, and cis-7-hexadecanoic acid at 19.6 minutes. Additional chemicals, such as furan carboxylic acid and eugenol, were observed in the spectra. The figures 3,4 and 5 below show the spectrums of the three fractions.


DISCUSSION
The objective of the study was to assess the phytochemical composition, antidiabetic potential, and radical scavenging activity of Kigelia africana. The findings indicate that chloroform exhibited the highest extraction efficiency. The antidiabetic activity of the ethyl acetate fraction was shown to be superior to that of the standard medication Glibenclamide (p=0.1572). Additionally, the ethyl acetate fraction exhibited the greatest levels of total phenolic and total flavonoid content. Among the compounds tested, it was observed that butanol exhibited the most favourable IC50 value in relation to DPPH. The extractive values identified in this investigation exhibited conformity with the findings of Dzomba and Mhini,[17] wherein a diminished extractive value of ethyl acetate extracts in relation to ethanol extracts was recorded during the extraction of Kigelia fruit. The utilisation of diverse solvents in the process of partitioning the extract facilitated the separation of phytochemicals based on their distinct polarity. Despite exhibiting the highest extraction value, the chloroform partition failed to yield significant potency or substantial quantities of phenols and flavonoids. Nevertheless, the gas chromatography-mass spectrometry (GC-MS) analysis revealed a higher concentration of fatty acids in the chloroform fraction in comparison to the other fractions. This phenomenon may be contributing to the observed increase in extractive value thus validating effect of process of phytochemical extraction on polarity of extracted phytochemicals.[18] In a study conducted by Babbar et al., it was demonstrated that alterations in polarity exerted an influence on the phenolic content found in plant extracts.[7] Similar to the findings of the aforementioned study, ethyl acetate exhibited a favourable capacity for extracting phenolic components. Subsequent studies have demonstrated that oxidative stress is associated with a decline in the mass of pancreatic cells, diminished insulin sensitivity, and reduced activation of insulin receptors, hence contributing to the development of diabetes mellitus and its associated problems.[19] Hence, the utilisation of antioxidants would yield advantageous outcomes. Research findings indicate that the coexistence of phenols and flavonoids is correlated with elevated levels of antioxidant capacity[20] and the ability to mitigate the effects of diabetes.[7-18] This phenomenon has been demonstrated in rodent models that were administered plant extracts abundant in these compounds,[21-22] which aligns with the findings found in the present investigation. Despite the fact that the ethyl acetate fraction exhibited the most diminished blood glucose levels at the conclusion of the trial, it is noteworthy that all fractions showed a reduction in blood glucose levels subsequent to the induction of diabetes. The observed decrease in blood glucose levels caused by fractions exhibiting antioxidant and DPPH inhibitory activity aligns with our research findings, which indicate that there is no statistically significant distinction in total phenolic content (p=0.3292) and total flavonoid content (p=0.061) among the different partitions. The findings of this investigation indicate that the TPC, TFC, DPPH inhibitory activity and antihyperglycemic activity of the Kigelia fractions align with the results obtained from the GC-MS analysis. The utilization of Gas Chromatography-Mass Spectrometry (GC-MS) allowed for the identification of several substances that exhibited varying amounts within the three fractions. The fatty acid composition, namely encompassing stearic acid, oleic acid, ricinic acid, and palmitic acid, has been identified as possessing antioxidant capabilities.[23] While certain fatty acids, like oleic acid, have been found to have positive effects on diabetes, there are differing opinions on the benefits of other fatty acids, such as palmitic acid. Some researchers argue that palmitic acid may contribute to glucose intolerance and obesity.[8,24,25] Therefore, it is plausible that this factor may have had a role in the reduced antihyperglycemic efficacy of the chloroform fraction in comparison to the ethyl acetate fraction, as the latter exhibited a lower concentration of fatty acids. The GC-MS analysis also detected chemicals that are known to possess properties related to both antioxidant and antidiabetic activities. For instance, studies have demonstrated that derivatives of furan carboxylic acid possess therapeutic properties in managing diabetes.[26-27] Additionally, various compounds such as hydroxy methyl furfural, eugenol, trans ferulic acid, 2,4-dibutyl tetra phenol, cinnamic acid derivatives, pyridine, and pyrimidine derivatives have been found to exhibit antioxidant and antidiabetic effects. These compounds have demonstrated the ability to enhance pancreatic beta-cell function and glucose utilisation, as well as block the activity of alpha-amylase and alpha-glucosidase.[28-29] Therefore, the presence of these compounds, as determined through the use of gas chromatography-mass spectrometry (GC-MS) analysis, provides an explanation for the observed antidiabetic effects of the fruit extract fractions in rats with diabetes.
The specific mechanism through which the fruit fractions exert their antidiabetic effects was not elucidated in this study. However, it is plausible to propose that the observed combination of phytocomponents identified through gas chromatography-mass spectrometry (GC-MS) may have contributed to the amelioration of diabetes by enhancing insulin secretion and utilisation, as well as inhibiting glucose-metabolizing enzymes. Hence, this research provides scientific validation for the historical utilisation of Kigelia africana in individuals with diabetes. However, it is imperative to conduct further investigation into potential pharmacological interactions with other antidiabetic medications.
CONCLUSION
There was no statistically significant disparity observed in the total flavonoid content (TFC) and total phenolic content (TPC) among the various fractions although the ethyl acetate fraction had higher readings. All partitions exhibited DPPH scavenging action; however, the n-butanol partition demonstrated a comparatively larger IC50 value. All fractions had antidiabetic efficacy, with the ethyl acetate fraction displaying the highest level of activity. The phytochemical constitution and quantities varied among the three fractions, resulting in differences in the degree of the antidiabetic and antioxidant bioactivity exhibited by each fraction.
What is known about this study?
• Kigelia africana has antidiabetic activity.• Kigelia africana fruit have antioxidant activity.
• Some flavonoids may have antidiabetic activity.
What is the study adding?
• Phytochemical compounds associated with observed antidiabetic activity.• Total phenolic and total flavonoid content of the fruit in relation to antidiabetic activity.
• Reporting on Kigelia growing in Southern Africa (significant due to differences in geographical location and conditions)
DECLARATION OF CONFLICTING INTERESTS
There are no conflicts of interest to declare
Acknowledgements
Mr. Mainza Chona Makondo, Mr. Alick Tembo, Mr. Josphat Chizambe and Dr. Joey Chifamba, who were of valuable support during the data collection period.
Funding
This study was partly funded by Mulungushi University. The funder did not influence the choice of article submission nor did they have involvement in the study.
Authors’ contributions
Authors (Tumelo Akapelwa Muyenga, Bamitale K. Dominion Samuel, Kibuule Dan, Christabel N. Hikaambo, Mutenta Nsokolo Nyambe, Ezeala Christian) contributed to the conceptualization and appraised the article through the various stages of development. Tumelo Akapelwa Muyenga performed the data analysis. All authors reviewed successive drafts and approved the final version.REFERENCES
- Mwila KF, Bwembya PA, Jacobs C. (2019). Experiences and challenges of adults living with type 2 diabetes mellitus presenting at the University Teaching Hospital in Lusaka, Zambia. BMJ Open Diabetes Research and Care, 7(1), e000497. Retrieved from https://drc.bmj.com/content/7/1/e000497
- Nangandu Hikaambo, C., Namutambo, Y., Kampamba, M., Mufwambi, W., Kabuka, R., Chulu, M., ... (2022). Prevalence and patterns of herbal medicine use among Type 2 Diabetes Mellitus patients at the University Teaching Hospitals in Lusaka. Journal of Biomedical Research and Environmental Science, 3(1), 74–81. https://www.jelsciences.com/articles/jbres1402.pdf
- Ameade, E. P. K., Ibrahim, M., Ibrahim, H. S., Habib, R. H., & Gbedema, S. Y. (2018). Concurrent use of herbal and orthodox medicines among residents of Tamale, Northern Ghana, who patronize hospitals and herbal clinics. Evidence-Based Complementary and Alternative Medicine, 2018, 1289125.
- Muyenga, T., Musonda, D., & Chigunta, M. (2018). Ethnobotanical survey of medicinal plants used in the treatment of diabetes in Chipulukusu Compound, Ndola District, Zambia. Journal of Preventive and Rehabilitative Medicine, 1(1), 39–44. Retrieved from https://journals.unza.zm/index.php/medicine/article/view/35
- Kumar, S., Yadav, A., Yadav, M., & Yadav, J. P. (2017). Effect of climate change on phytochemical diversity, total phenolic content, and in vitro antioxidant activity of Aloe vera (L.) Burm. f. BMC Research Notes, 10(1), 60. https://doi.org/10.1186/s13104-017-2385-3
- Osman, A. G., Ali, Z., Chittiboyina, A. G., & Khan, I. A. (2017). Kigelia africana fruit: Constituents, bioactivity, and reflection on composition disparities. World Journal of Traditional Chinese Medicine, 3(4), 1. Retrieved from https://www.wjtcm.net/article.asp?issn=2311-8571;year=2017;volume=3;issue=4;spage=1;epage=6;aulast=Osman;type=0
- Babbar, N., Oberoi, H. S., Sandhu, S. K., & Bhargav, V. K. (2014). Influence of different solvents in the extraction of phenolic compounds from vegetable residues and their evaluation as natural sources of antioxidants. Journal of Food Science and Technology, 51(10), 2568–2575.
- Pastor, R., Bouzas, C., & Tur, J. A. (2021). Beneficial effects of dietary supplementation with olive oil, oleic acid, or hydroxytyrosol in metabolic syndrome: Systematic review and meta-analysis. Free Radical Biology and Medicine, 172, 372–385. https://www.sciencedirect.com/science/article/pii/S0891584921003828
- Sarian, M. N., Ahmed, Q. U., Mat So’ad, S. Z., Alhassan, A. M., Murugesu, S., Perumal, V., ... (2017). Antioxidant and antidiabetic effects of flavonoids: A structure-activity relationship based study. BioMed Research International, 2017, e8386065. https://www.hindawi.com/journals/bmri/2017/8386065/
- Singh, S., & Patil, K. (2022). Trans-ferulic acid attenuates hyperglycemia-induced oxidative stress and modulates glucose metabolism by activating the AMPK signaling pathway in vitro. Journal of Food Biochemistry, 46.
- AL-Ishaq, R. K., Abotaleb, M., Kubatka, P., Kajo, K., & Büsselberg, D. (2019). Flavonoids and their anti-diabetic effects: Cellular mechanisms and effects to improve blood sugar levels. Biomolecules, 9(9), 430. https://www.ncbi.nlm.nih.gov/pmc/articles/PMC6769509/
- Emran, T., Rahman, M. A., Uddin, M. M. N., Rahman, M., Uddin, M., Dash, R., ... (2015). Effects of organic extracts and their different fractions of five Bangladeshi plants on in vitro thrombolysis. BMC Complementary and Alternative Medicine, 15, 1–8.
- Makkar, H. P. S., Bluemmel, M., Borowy, N. K., & Becker, K. (2000). Quantification of tannins in tree foliage: A laboratory manual for the FAO/IAEA coordinated research project on "Use of nuclear and related techniques to develop simple tannin assays for predicting and improving the safety and efficiency of feeding ruminants on tanniniferous tree foliage." International Atomic Energy Agency (IAEA), 26.
- Masuku, N., & Lebelo, S. (2019). Investigation of the effects of Kigelia africana (Lam.) Benth. extracts on Tm3 Leydig cells. Asian Journal of Pharmaceutical and Clinical Research, 87–92.
- Swarnalatha, K., Babu, C., & Bollikolla, H. B. (2019). Phytochemical screening, anti-diabetic, and antioxidant activities of Kigelia africana (LAM.) and Sterculia foetida L. Rasayan Journal of Chemistry, 12, 907–914.
- Muyenga, T., Prashar, L., Muungo, T., & Bwalya, A. G. (2015). The effect of Kigelia africana fruit extract on blood glucose in diabetes-induced mice. ResearchGate. Retrieved from https://www.researchgate.net/publication/335528459_The_effect_of_Kigelia_Africana_fruit_extract_on_blood_glucose_in_diabetes_induced_mice
- Dzomba, P., & Mhini, G. (2021). Isolation and quantification of flavonoids from Kigelia africana (Lam.) Benth fruit and bark and their antiradical and antibacterial activities.
- Tatipamula, V. B., & Kukavica, B. (2021). Phenolic compounds as antidiabetic, anti‐inflammatory, and anticancer agents and improvement of their bioavailability by liposomes. Cell Biochemistry and Function, 39(8), 926–944. https://onlinelibrary.wiley.com/doi/10.1002/cbf.3667
- Darenskaya, M. A., Kolesnikova, L. I., & Kolesnikov, S. I. (2021). Oxidative Stress: Pathogenetic Role in Diabetes Mellitus and Its Complications and Therapeutic Approaches to Correction. Bulletin of Experimental Biology and Medicine, 171(2), 179–189. https://doi.org/10.1007/s10517-021-05191-7
- Ofosu, F. K., Elahi, F., Daliri, E. B. M., Chelliah, R., Ham, H. J., Kim, J. H., ... (2020). Phenolic profile, antioxidant, and antidiabetic potential exerted by millet grain varieties. Antioxidants, 9(3), 254. https://www.mdpi.com/2076-3921/9/3/254
- Vu, N. K., Kim, C. S., Ha, M. T., Ngo, Q. M. T., Park, S. E., Kwon, H., ... (2020). Antioxidant and antidiabetic activities of flavonoid derivatives from the outer skins of Allium cepa L. Journal of Agricultural and Food Chemistry, 68(33), 8797–8811. https://doi.org/10.1021/acs.jafc.0c02122
- Zhao, J., Gao, J., & Li, H. (2020). Ferulic acid confers protection on islet β cells and placental tissues of rats with gestational diabetes mellitus. Cellular and Molecular Biology, 66(1), 37–41. http://cellmolbiol.org/index.php/CMB/article/view/3151
- Choi, Y. M., Yoon, H., Shin, M. J., Lee, Y., Hur, O. S., Lee, B. C., ... (2021). Metabolite contents and antioxidant activities of soybean (Glycine max (L.) Merrill) seeds of different seed coat colors. Antioxidants, 10(8), 1210. https://www.mdpi.com/2076-3921/10/8/1210
- Kochikuzhyil, B. M., Devi, K., & Fattepur, S. R. (2010). Effect of saturated fatty acid-rich dietary vegetable oils on lipid profile, antioxidant enzymes, and glucose tolerance in diabetic rats. Indian Journal of Pharmacology, 42(3), 142–145. https://www.ncbi.nlm.nih.gov/pmc/articles/PMC2937313/
- Mancini, A., Imperlini, E., Nigro, E., Montagnese, C., Daniele, A., Orrù, S., ... (2015). Biological and nutritional properties of palm oil and palmitic acid: Effects on health. Molecules, 20(9), 17339–17361. https://www.mdpi.com/1420-3049/20/9/17339
- Chen, L., Huang, S., Ye, Y., Shen, Y., Xu, T., Qin, L., ... (2023). Phenotypic screening-based drug discovery of furan-2-carboxylic acid derivatives for the amelioration of type 2 diabetes mellitus (T2DM). European Journal of Medicinal Chemistry, 246, 114994. https://www.sciencedirect.com/science/article/pii/S0223523422008960
- He, M., Li, Y. J., Shao, J., Fu, C., Li, Y. S., & Cui, Z. N. (2023). 2,5-Disubstituted furan derivatives containing imidazole, triazole, or tetrazole moiety as potent α-glucosidase inhibitors. Bioorganic Chemistry, 131, 106298. https://www.sciencedirect.com/science/article/pii/S0045206822007040
- Adisakwattana, S., Chantarasinlapin, P., Thammarat, H., & Yibchok-Anun, S. (2009). A series of cinnamic acid derivatives and their inhibitory activity on intestinal α-glucosidase. Journal of Enzyme Inhibition and Medicinal Chemistry, 24(5), 1194–1200. https://doi.org/10.1080/14756360902779326
- Shayan-Nasr, M., Ghaniei, A., Eslami, M., & Zadeh-Hashem, E. (2021). Ameliorative role of trans-ferulic acid on induced oxidative toxicity of rooster semen by β-cyfluthrin during low-temperature liquid storage. Poultry Science, 100(9), 101308. https://www.sciencedirect.com/science/article/pii/S0032579121003424
Medical Journal of Zambia, Vol 50, 1
The Medical Journal of Zambia, ISSN 0047-651X, is published by the Zambia Medical Association.
© This is an Open Access article distributed under the terms of the Creative Commons Attribution License, which permits unrestricted use, distribution, and reproduction in any medium, provided the original work is properly cited.