Vitamin D deficiency and its associated factors in active TB patients at a tertiary hospital and three primary health care level facilities in Lusaka, Zambia: A cross sectional analytical study
Chalomba Chitanika
Department of Medicine, University Teaching Hospital-Lusaka, Zambia
Department of Medicine, Levy Mwanawasa University Teaching Hospital-Lusaka, Zambia
Patrick Lungu
Department of Medicine, University Teaching Hospital-Lusaka, Zambia
National Tuberculosis and Leprosy Control Program, Zambia
Shabir Lakhi
Department of Medicine, University Teaching Hospital-Lusaka, Zambia
DOI: https://doi.org/10.55320/mjz.50.2.347
Keywords: Tuberculosis; Vitamin D deficiency; under nutrition.
ABSTRACT
Background: Tuberculosis (TB) remains a leading infectious cause of morbidity and mortality in Zambia. Vitamin D deficiency has been associated with increased TB incidence and severity but data for the Zambian setting is lacking, inclusive of the general population. We sought to determine the prevalence of vitamin D deficiency and its associated factors in active TB patients in comparison to matched adults from the general population without TB, and to compare clinical and radiological severity of TB based on vitamin D status.
Methods: We enrolled 89 TB patients and 78 matched adults from the general population. Demographic and clinical data was collected. The key findings on physical examination were body mass index (BMI), mid upper arm circumference (MUAC), and signs of under nutrition. Clinical severity was assessed using the TB I Score and the Karnofsky Performance Index (KPI).Chest x-ray and measurement of serum vitamin D levels were done. Radiological severity was assessed using the Timika chest x-ray score. Vitamin D was measured using the Cobas® E411 analyser from Roche Diagnostics (Germany) with vitamin D deficiency defined as <30 ng/ml and chi square used to analyse vitamin D deficiency as a categorical variable.
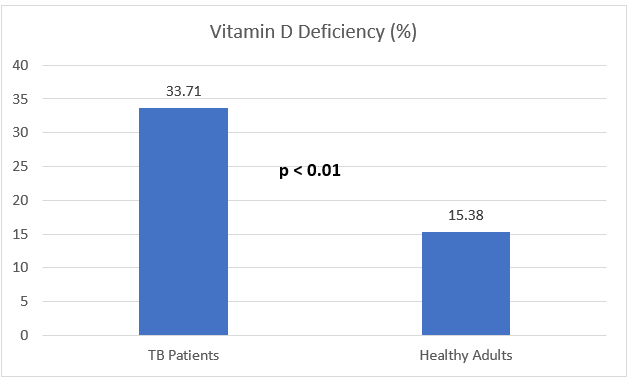
Results: The median (IQR) age was 27.5 (24-38) years in the TB patients and 32 (25-37) years in the non-TB adults (p=0.30).Sixty-nine (77.53%) of the TB patients and 57 (73.08%) of the comparison group were male (p=0.51). The prevalence of vitamin D deficiency was 33.71 % in the TB patients and 15.38% in the comparison group (p <0.01). Associations with vitamin D deficiency were active TB (AOR =2.27; 95% CI = 1.04- 4.95; p=0.04) and under nutrition (AOR 14.5; 95% CI 1.65-126.97; p=0.02). Median (IQR) KPI was 70 (60-80) in the vitamin D deficient patients compared to 80 (70-90) in non- vitamin D deficient patients (p=0.01). Median (IQR) Timika chest x-ray score was 75 (45-115) in the vitamin D deficient TB patients compared to 42.5 (20-75) in the non- vitamin D deficient patients (p<0.01).
Conclusions: We found a significant difference in the prevalence of vitamin D deficiency in active TB patients compared with matched non-TB adults. Vitamin D deficiency was associated with active TB and under nutrition. TB patients with vitamin D deficiency had more clinical and radiological severe disease than those with normal vitamin D levels. These findings warrant further studies on the role of vitamin D supplementation in TB in Zambia.
INTRODUCTION
Tuberculosis (TB), an infection caused by the Mycobacterium Tuberculosis complex is an ancient disease that remains a public health concern[1] . According to the World Health Organization, 5.8 million people contracted TB in 2020 with over a million deaths worldwide[2] . Africa continues to be one of the most affected continents. Zambia is a high burden TB country with an estimated TB incidence rate of 319 per 100,000 in 2021[3] .
Vitamin D is a fat soluble vitamin that is acquired from dietary sources and synthesised in the skin under the influence of ultraviolet light[4] . Though it has classically been associated with calcium metabolism, research has linked vitamin D with immunity against TB[5] . Vitamin D receptors have been identified on macrophages and lymphocytes, cells that are involved in the immune response against TB[6] . The mechanism for this effect is thought to be the up-regulation of the synthesis of anti-mycobacterial peptides such as cathelicidin and β-defensin[7] . Research has validated a positive correlation between vitamin D levels and cathelicidin levels[8] .
Consequently, low vitamin D status has been associated with an increased risk of contracting TB [9] .A study in Pakistan showed that close contacts of TB patients with low vitamin D levels were five times more at risk of TB than those with normal levels[10] . Ethiopian studies showed a higher prevalence of vitamin deficiency in TB patients compared to controls[11-12] . Research has revealed increased severity of TB symptoms in vitamin D deficient TB patients[13] . In contrast, studies from Gambia and Zimbabwe found associations between elevated vitamin D levels and TB[14-15] .
Meanwhile Zambia continues to grapple with the onslaught of TB .An estimated 15,000 Zambians succumbed to the disease in 2021[3] . This is compounded by the rise in the amount of drug resistant TB [16] . Despite the link between TB and vitamin D, and Zambia being heavily burdened with the disease, vitamin D levels in Zambian TB patients and the general population remain unknown[17] . This study therefore aimed to determine the prevalence of vitamin D deficiency and its associated factors in active TB patients and matched adults without TB from the general population, and compare the clinical and radiological severity TB in patients, according to vitamin D status.
MATERIALS AND METHODS
Study Area
The study took place in Lusaka, Zambia between May 2020 and December 2020, at University Teaching Hospitals -Adult Hospital (UTH) and three first level hospitals levels (Chawama, Chipata and Kanyama) in Lusaka, Zambia .Recruitment of participants was initially scheduled to be held at the UTH only, but the coming of COVID-19 saw a drastic drop in TB patients presenting to the facility, so the three first level hospitals were added because of their relatively high TB numbers and their being in Lusaka. This enabled the sample size to be met and the study to be adequately powered.UTH is the highest referral centre in Zambia with TB treatment at the facility being dispensed by the chest clinic. It attends to up to 900 patients yearly. Kanyama first level hospital is a 139-bed capacity facility with a catchment population of 96,465 people and a TB clinic with an average patient of 30 patients per week. Chawama first level hospital is a 74-bed capacity facility with a catchment population of 130,000 people and a TB corner dispensing treatment to around 300 patients weekly. Chipata first level hospital is a 71-bed capacity centre with a chest clinic that attends to up to 200 TB patients weekly.
Study Population
TB patients aged 18 and above were conveniently sampled from the chest clinics and medical wards at the recruitment centres. The participants in the comparison group were matched with the TB patients for age group, gender, and HIV status. They were recruited among blood donors at the UTH blood bank, outpatient clinics among those attending routine medicals for employment and education purposes, and the Adult Centre of Infectious Diseases among stable HIV patients doing routine drug refills.
Case Definitions
An active TB patient was defined as one whose diagnosis had been confirmed by either sputum acid fast bacilli staining, Gene X-pert® or TB culture and had been on treatment for less than seven days. Patients that had been on Rifampicin based treatment for more than one week, were excluded from the study. The rationale behind this is the potential lowering effect of Rifampicin on serum vitamin D levels. Serum vitamin D has a half-life of two weeks, therefore excluding patients that had taken Rifampicin for one week or more guarded against its confounding effect[4] . A non-TB adult was defined as a person above the age of 18 with no complaints at the time of recruitment and negative for the symptoms for TB and no radiological or microbiological evidence of TB.Participants with a history of TB, vitamin D supplementation within three months, household contacts of TB patients(defined per national TB guidelines as a person that had shared the same enclosed living space with the index case 3 months before the diagnosis of TB[3] ) ,as well as those not consenting to an HIV test were excluded.
Collection of Data
Data was collected and entered onto a data entry tool. Demographics included the participant’s age, gender, residential area, and employment status. The participants estimated the duration of their daily sunlight exposure. A history of alcohol and tobacco use was elicited. Karnofsky Performance Index (KPI) was graded by an experienced clinician to assess functional status. KPI is an assessment tool for functional impairment that has been used in Tuberculosis[18] . The parameters that are assessed include the ability to carry out normal work, ability for self-care and the need for hospitalisation. The scale ranges from 0-100 with a lesser score implying a greater degree of functional impairment.All the study participants had their BMI and MUAC taken. Participants were assessed for under nutrition with markers being, wasting of temporal muscles, thin hair, scaling of the skin, angular stomatitis, and oedema[19] . Participants had their signs and symptoms aggregated into the TB I Bandim Score as another marker of disease severity[20] . This is a scoring system based on the number of symptoms in a TB patient. More symptoms denote a higher score and vice versa.
Investigations included serum albumin and a chest radiograph. Interpretation of the chest x-ray was carried out by a radiologist. The Timika Chest X-ray score used to grade the radiological extent of disease[21] . This is a scoring system for x-rays that is based on the proportion of the lung fields that are involved in the disease process. A greater score indicates more lung involvement and contrary wise.
Measurement of Vitamin D
Serum was extracted from 4 mls of collected blood and stored at -80˚C. Measurement of 25(OH) D was done using the Cobas® e411 analyser from Roche Diagnostics (Germany) using the Elecsys Vitamin D total II assay which uses the mechanism of employing a vitamin D binding protein to capture 25‑hydroxyvitamin D. It measures 25 (OH) D levels in the ranges of 3‑100 ng/ml. Vitamin D deficiency was defined as a serum level of 25 hydroxyvitamin D of < 30ng/ml[22] .
Statistics
Statistical analysis for the study was carried out using the Stata® version 14 from the Stata Cooperation (USA). The outcome variable was the presence or absence of vitamin D deficiency. Independent variables showing disease severity were Karnofsky performance Index, TB I Bandim Score and the Timika Chest X-ray score. Vitamin D deficiency was analysed as a categorical variable using chi square. Karnofsky performance Index, TB I Bandim Score and Timika Chest X-ray score were analysed as continuous variables. The Shapiro -Wilk test was used to assess them for distribution pattern. The TB I Score was normally distributed while the Karnofsky Performance Index and Timika chest x-ray score had skewed distributions. We assessed the TB I Score using the T- test while the Mann Whitney test was used for the Karnofsky Performance Index and Timika Chest X-ray score.The other independent variables were classified into categorical and continuous variables. The categorical variables included gender, HIV status, TB status, area of residence, season of recruitment, alcohol and tobacco use, and presence or absence of under nutrition. These were expressed as proportions and analysed using the chi square or fisher’s exact tests for those values that had a value of less than five in the two-by-two tables.
The main continuous variables were age, hours of sunlight exposure, BMI, MUAC, serum albumin and the creatinine clearance. The Shapiro-Wilk test was used to assess all the continuous variables for normality of distribution. The BMI, MUAC, serum albumin and creatinine clearance were normally distributed while the age and hours of sunlight exposure had skewed distributions. The normally distributed variables were analysed using the t-test while the skewed variables were analysed with the Mann Whitney Test. Factors associated with vitamin D deficiency were assessed using a multivariate logistic regression model. The study was powered at 80%. For all the analysed variables, a p value of less than 0.05 indicated statistical significance.
Ethical Considerations This study was approved by University of Zambia Biomedical and Research Ethics committee under approval number 398-2019, and the National Health Research Authority of Zambia. Written, informed consent was obtained from all the participants.
RESULTS
Study Process
A total of 180 participants were enrolled, among which 89 (49.44 %) were TB patients and 91 (50.56%) were adults without TB from the general population. All the enrolled TB patients and 78 (85.71%) of the comparison group of that were included in the analysis. We included 62 (69.70 %) of the 89 TB patients in the radiological analysis as 27 patients were missing chest x-ray images due to malfunction of chest x-ray machines at some of the study centres. Six (6.70%) of the comparison group were excluded based on clinical grounds while seven (7.69%) denied consent after initially agreeing to participate (figure 1).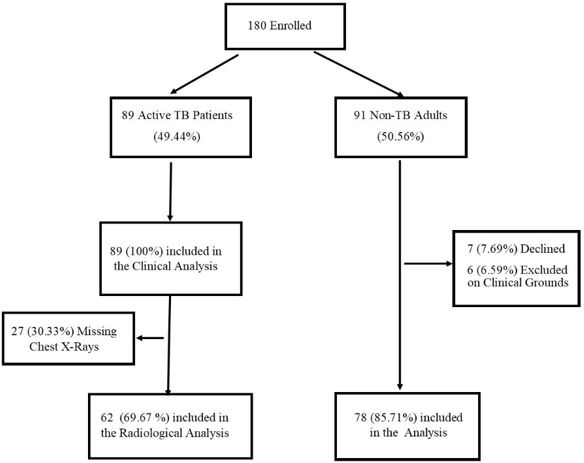
Baseline Characteristics of Study Participants
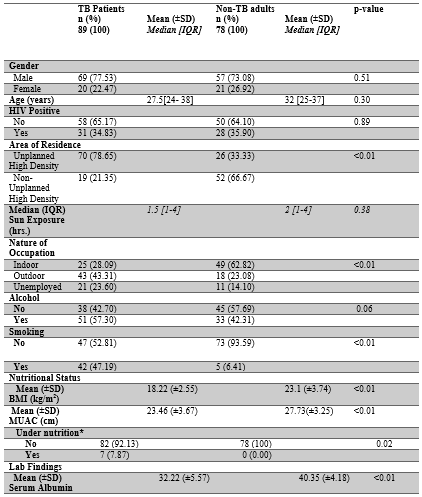
Sixty-nine (77.53%) of the TB patients and 57 (73.08%) of the comparison group were male (p=0.51). The median (IQR) age for the TB patients was 27.5 (24-38) years and 32 (25-37) years in the comparison group (p=0.30). The number of employed participants was 68 (76.4%) in the TB group and 67 (85.90%) in the comparison group respectively (p<0.01). Thirty-one (34.83%) of the TB patients and 28 (35.90%) of the non-TB adults were HIV positive (p=0.89). The median (IQR) duration of sunlight exposure was 1.5 (1-4) hours in the TB patients and 2 hours (1-4) in the comparison group (p=0.38).Among the TB patients, 51(57.30%) admitted to using alcohol while this number was 33 (42.31%) in the non-TB adults (p =0.06). Regarding tobacco use, 42 (47.19%) of the TB patients and 5 (6.41%) from the non -TB group admitted to using tobacco respectively (p<0.01). The mean (±SD) BMI in the TB patients was 18.22(± 2.55) kg/m2and 23.10 (± 3.74) kg/m2 in the comparison group (p<0.01). The mean (±SD) MUAC was 23.46 (± 3.67) cm in the TB patients and 27.73 (± 3.25) cm in the comparison group (p<0.01). TB patients had a mean (±SD) serum albumin of 32.22 (± 5.57) g/l in comparison to the adults from the general population that had a mean serum albumin of 40.35 (± 4.18) g/l (p<0.01) (Table 1).
Prevalence of Vitamin D Deficiency in TB Patients and Matched non-TB Adults from the general population.
Comparison of TB Patients based on vitamin D status.
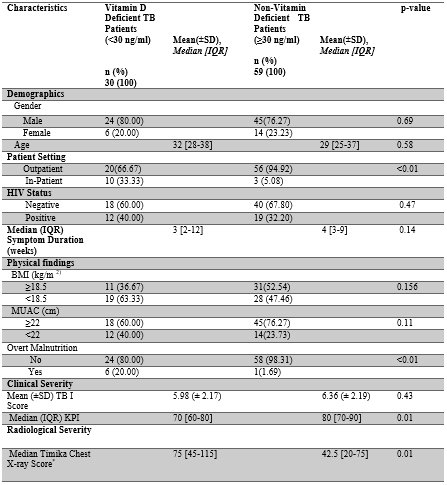
In terms of gender, 24 (80%) of the deficient patients and 45 (76.27%) in the non- deficient patients were male (p=0.69). The median (IQR) age in the patients with vitamin D deficiency was 32 (28-32) years, compared to 29 (25-37) years in the patients with normal vitamin D levels (p=0.58). Ten (33.33 %) of the deficient patients were in-patients while 3 (5.08%) of non-deficient patients were admitted respectively (p<0.01).Twelve (40 %) of the patients with suboptimal vitamin D levels had HIV in comparison to 19 (32.20%) from the patients with normal vitamin D levels (p=0.47). The median (IQR) symptom duration in the deficient TB patients was 3 (2-12) weeks, while this number was 4 (2-9) weeks in the non- deficient patients (p=0.14). With regards to nutritional status, 19 (63.33%) of the vitamin D deficient patients had a BMI less than 18.5 kg/m2 in comparison to 28 (47.46%) in the non- deficient group (p=0.16). A MUAC of less than 22 cm was present in 12 (40%) of vitamin D deficient patients and 14 (23.73%) of non-vitamin D deficient TB patients (p=0.11). Six (20%) of the vitamin D deficient patients and one (1.69%) of the non-deficient patients were found with signs of under nutrition (p <0.01).
Regarding disease severity, the mean (±SD) TB I score in the vitamin D deficient group was 5.98 (±2.17) and 6.36 ((±2.19) in the non-deficient group (p=0.43). The median (IQR) Karnofsky Performance Index was 70 (60-80) in the deficient patients and 80 (70-90) in the non-deficient patients respectively (p < 0.01). The median (IQR) Timika chest x-ray score was 75 (45-115) in the deficient patients and 42.5 (20-75) in the non-deficient patients respectively (p=0.01) (Table 2).
Factors Associated with Vitamin D Deficiency
In the unadjusted model for all predictor variables, the factors associated with vitamin D deficiency were active TB (COR= 2.80; 95% CI=1.31-5.96; p <0.01), a BMI less than 18.5 kg/m2 (COR=2.50; 95% CI = 1.21-5.20 p=0.01) and under nutrition (COR=20.66; 95% CI = 2.4-177.2 p<0.01). After controlling for other variables, the associated factors with vitamin D deficiency were active TB (AOR=2.27; 95% CI = 1.04-4.95; p=0.04) and under nutrition (AOR=14.5; 95% CI = 1.65-126.97; p=0.02) (Table 3).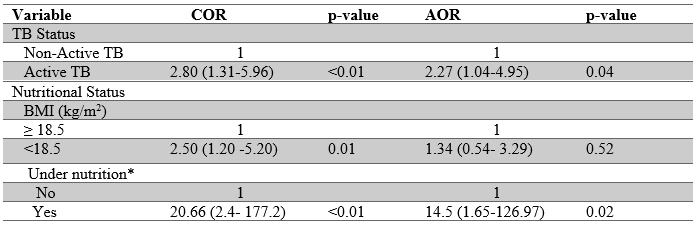
DISCUSSION
Our findings reveal a higher prevalence of vitamin D deficiency in TB patients in comparison to matched adults without TB from the general population. This is in agreement with most literature[6] .This study augments the findings of Lungu et al in a Zambian case series where TB patients were found to be vitamin D deficient[23] . A prevalence of vitamin D deficiency of 33.71% in the TB patients from our study is higher than the findings of Nouri Vaskeh et al in Iran (13.3%) and Wejste et al in Guinea Bissau (9%), but it is lower than reports from London by Ustianowski et al (40%) and Workineh et al in Ethiopia (86%). Possible explanations for this finding are discrepancies in the diets of the populations, variations in the climate they are exposed to, different vitamin D measurement methodologies and thresholds of vitamin D deficiency[24] . There are varying definitions of vitamin D deficiency. The threshold of 30ng/ml was used in this study because the vast majority of experts agree that levels below this number are suboptimal[22] .Among the comparison group, 15.38% had vitamin D deficiency. This finding is at odds with findings by Jaimni et al in India (26%) and Taseem et al in Ethiopia (38%). Apart from the above reasons, an additional cause for this difference could be the inclusion of some contacts of the TB patients as a comparison group in their studies.
The association between vitamin D deficiency and active TB in our study concurs with literature linking low vitamin D to impaired immunity against TB[25] .Vitamin D has been shown to aid anti-mycobacterial activity by inducing the production of antimicrobial peptides from the cathelicidin family and enhancing the capacity of macrophages to kill MTB[7] . The other associated factor with vitamin D deficiency was under nutrition. This is in agreement of the findings by Meker et al on the high prevalence of vitamin D deficiency in undernourished TB patients[26] .This could be explained by the fact that TB patients with malnutrition have both poor intake of food and malabsorption of nutrients, among which is vitamin D[27] . A breakdown of the TB patients based on vitamin D status found a significant association between being admitted in hospital and being vitamin D deficient. Banda et al in Malawi had similar findings[28] . A plausible reason for this finding is that patients requiring admission are not exposed to as much sunlight as outpatients [29] .
TB patients with vitamin D deficiency had a lower Karnofsky Performance index than the non-deficient TB patients and a lower (though not statistically significant) TB I Score .These findings add up to a higher level of clinical severity which agrees with findings by Farazi et al that showed a higher disease severity in TB patients with lower vitamin D levels[13] . We also noted that the vitamin D deficient TB patients had more radiological involvement compared to the non- vitamin D deficient patients. This could be as a result of the link between vitamin D deficiency with a more damaging inflammatory response and less repairing immunomodulatory response[6] .We did not find a significant difference in HIV status between the deficient and non-deficient TB patients which was contrary to findings in literature[30] . This may be because Efavirenz an antiretroviral which is has been implicated in low vitamin D levels has been phased out of the 1st line regimen in Zambia[31] .
Study limitations
The cross-sectional design of our study means causation cannot be proved. We did not match the TB patients and the comparison group for social economic status which is a proxy for factors that could affect vitamin D levels such as access to nutrition. Another limitation is that some of our participants from the TB group were in-patients in contrast to the comparison group. Weighting to the sample size calculation was not added for the different recruitment centres so this may have skewed the results.CONCLUSION
We found a significant difference in the prevalence of vitamin D deficiency in active TB patients compared with matched non-TB adults from the general population. Vitamin D deficiency was associated with active TB and under nutrition. Vitamin D deficiency in active TB was associated with more severe disease clinically and radiologically. The above findings warrant further studies on the role of vitamin D and TB possible vitamin D supplementation in TB in a high burden setting like Zambia.
ACKNOWLEDGEMENTS
We thank the participants and the staff at the chest clinics, laboratories, and radiology staff from the facilities where the study took place.
Data availability
The data confirming these findings are available from the corresponding author, CC, upon reasonable request.
Competing Interests
None.REFERENCES
- Barberis I, Bragazzi NL, Galluzzo L, Martini M. The history of tuberculosis: from the first historical records to the isolation of Koch's bacillus. J Prev Med Hyg. 2017 Mar;58(1):E9-E12. PMID: 28515626; PMCID: PMC5432783.
- World Health Organization. World Health Statistics 2022: Monitoring Health for the SDGs, Sustainable Development Goals. World Health Organization; 2022. Accessed July 21, 2022. https://apps.who.int/iris/handle/10665/356584
- Zambian Ministry of Health. National Strategic Plan for Tuberculosis and Leprosy Prevention, Care, and Control (2022 - 2026)
- Bikle DD. Vitamin D Metabolism, Mechanism of Action, and Clinical Applications. Chem Biol. 2014;21(3):319-329. doi:10.1016/j.chembiol.2013.12.016
- Zhang S, Miller DD, Li W. Non-Musculoskeletal Benefits of Vitamin D beyond the Musculoskeletal System. Int J Mol Sci. 2021; 22(4):2128. doi:10.3390/ijms22042128
- Hewison M. Vitamin D and the Immune System: New Perspectives on an Old Theme. Endocrinol Metab Clin North Am. 2010; 39(2):365-379. doi:10.1016/j.ecl.2010.02.010
- Chung C, Silwal P, Kim I, Modlin RL, Jo EK. Vitamin D-Cathelicidin Axis: at the Crossroads between Protective Immunity and Pathological Inflammation during Infection. Immune Netw. 2020;20(2):e12. doi:10.4110/in.2020.20.e12
- Lungu PS, Kilembe W, Lakhi S, et al. A comparison of vitamin D and cathelicidin (LL-37) levels between patients with active TB and their healthy contacts in a high HIV prevalence setting: a prospective descriptive study. Trans R Soc Trop Med Hyg. 2022; 116(4):336-343. doi:10.1093/trstmh/trab126
- Huang SJ, Wang X, Liu ZD, et al. Vitamin D deficiency and the risk of tuberculosis: a meta-analysis. Drug Des Devel Ther. 2016; Volume11:91-102. doi:10.2147/DDDT.S79870
- Talat N, Perry S, Parsonnet J, Dawood G, Hussain R. Vitamin D Deficiency and Tuberculosis Progression. Emerg Infect Dis. 2010; 16(5):853-855. doi:10.3201/eid1605.091693
- Tessema B, Moges F, Habte D, et al. Vitamin D deficiency among smear positive pulmonary tuberculosis patients and their tuberculosis negative household contacts in Northwest Ethiopia: a case–control study. Ann Clin Microbiol Antimicrob. 2017; 16(1):36. doi: 10.1186/s12941-017-0211-3
- Workineh M, Mathewos B, Moges B, et al. Vitamin D deficiency among newly diagnosed tuberculosis patients and their household contacts: a comparative cross-sectional study. Arch Public Health. 2017; 75(1):25. doi:10.1186/s13690-017-0195-7
- Farazi A, Didgar F, Sarafraz A. The effect of vitamin D on clinical outcomes in tuberculosis. Egypt J Chest Dis Tuberc. 2017; 66(3):419-423. doi:10.1016/j.ejcdt.2017.01.004
- Owolabi O, Agbla S, Owiafe P, et al. Elevated serum 25-hydroxy (OH) vitamin D levels are associated with risk of TB progression in Gambian adults. Tuberculosis. 2016; 98:86-91. doi:10.1016/j.tube.2016.02.007
- Musarurwa C, Zijenah LS, Mhandire DZ, et al. Higher serum 25-hydroxyvitamin D concentrations are associated with active pulmonary tuberculosis in hospitalised HIV infected patients in a low income tropical setting: a cross sectional study. BMC Pulm Med. 2018; 18(1):67. doi:10.1186/s12890-018-0640-6
- World Health Organization. Shaping the Global Innovation and Access Landscape for Better Paediatric Medicines. World Health Organization; 2022. Accessed June 15, 2022. https://apps.who.int/iris/handle/10665/352200
- Palacios C, Gonzalez L. Is vitamin D deficiency a major global public health problem? J Steroid Biochem Mol Biol. 2014; 144:138-145. doi:10.1016/j.jsbmb.2013.11.003
- Rudolf F. The Bandim TBscore-reliability, further development, and evaluation of potential uses. Glob Health Action. 2014; 7(1):24303. doi:10.3402/gha.v7.24303
- Maskos A, Schmidbauer ML, Kunst S, et al. Diagnostic Utility of Temporal Muscle Thickness as a Monitoring Tool for Muscle Wasting in Neurocritical Care. Nutrients. 2022; 14(21):4498. doi:10.3390/nu14214498
- Rudolf F, Abate E, Moges B, et al. Increasing smear positive tuberculosis detection using a clinical score – A stepped wedge multicenter trial from Africa. Int J Infect Dis. 2021; 113:S55-S62. doi:10.1016/j.ijid.2021.03.041
- Chakraborthy A, Shivananjaiah A, Ramaswamy S, Chikkavenkatappa N. Chest X ray Score (Timika Score): An Useful Adjunct to Predict Treatment Outcome in Tuberculosis. Adv Respir Med. 2018; 86(5):205-210. doi:10.5603/ARM.2018.0032
- Amrein K, Scherkl M, Hoffmann M, et al. Vitamin D deficiency 2.0: an update on the current status worldwide. Eur J Clin Nutr. 2020; 74(11):1498-1513. doi:10.1038/s41430-020-0558-y
- Lungu, P., Lakhi, S., Mateyo, K., Mubiana, E., & Mwaba, P. (2018). A case series report of Tuberculosis patients with Vitamin D deficiency in Zambia. Medical Journal of Zambia, 45(1), 54–58. https://doi.org/10.55320/mjz.45.1.167.
- Tsiaras W, Weinstock M. Factors Influencing Vitamin D Status. Acta Derm Venereol. 2011; 91(2):115-124. doi:10.2340/00015555-0980
- Kearns MD, Tangpricha V. The role of vitamin D in tuberculosis. J Clin Transl Endocrinol. 2014; 1(4):167-169. doi:10.1016/j.jcte.2014.08.002
- Merker M, Amsler A, Pereira R, et al. Vitamin D deficiency is highly prevalent in malnourished inpatients and associated with higher mortality: A prospective cohort study. Medicine (Baltimore). 2019; 98(48):e18113. doi:10.1097/MD.0000000000018113
- Malnutrition in TB patients.pdf.
- Banda R, Mhemedi B, Allain TJ. Prevalence of vitamin D deficiency in adult tuberculosis patients at a central hospital in Malawi. Int J Tuberc Lung Dis. 2011 Mar; 15(3):408-10. PMID: 21333112.
- Ten Haaf DSM, Balvers MGJ, Timmers S, Eijsvogels TMH, Hopman MTE, Klein Gunnewiek JMT. Determinants of vitamin D status in physically active elderly in the Netherlands. Eur J Nutr. 2019; 58(8):3121-3128. doi:10.1007/s00394-018-1856-1
- Mansueto P, Seidita A, Vitale G, Gangemi S, Iaria C, Cascio A. Vitamin D Deficiency in HIV Infection: Not Only a Bone Disorder. BioMed Res Int. 2015; 2015:1-18. doi:10.1155/2015/735615
- Yin M, Stein E. The Effect of Antiretrovirals on Vitamin D. Clin Infect Dis. 2011; 52(3):406-408. doi:10.1093/cid/ciq169
Medical Journal of Zambia, Vol 50, 2
The Medical Journal of Zambia, ISSN 0047-651X, is published by the Zambia Medical Association.
© This is an Open Access article distributed under the terms of the Creative Commons Attribution License, which permits unrestricted use, distribution, and reproduction in any medium, provided the original work is properly cited.